


 June 3, 2026
In today’s data-driven enterprise landscape, business users need more than transactional applications—they need intelligent dashboards that provide real-time insights, visual analytics, and actionable information at a glance. SAP Fiori Overview Pages (OVP) address this requirement by bringing together multiple analytical and transactional data sources into a single, role-based user experience.
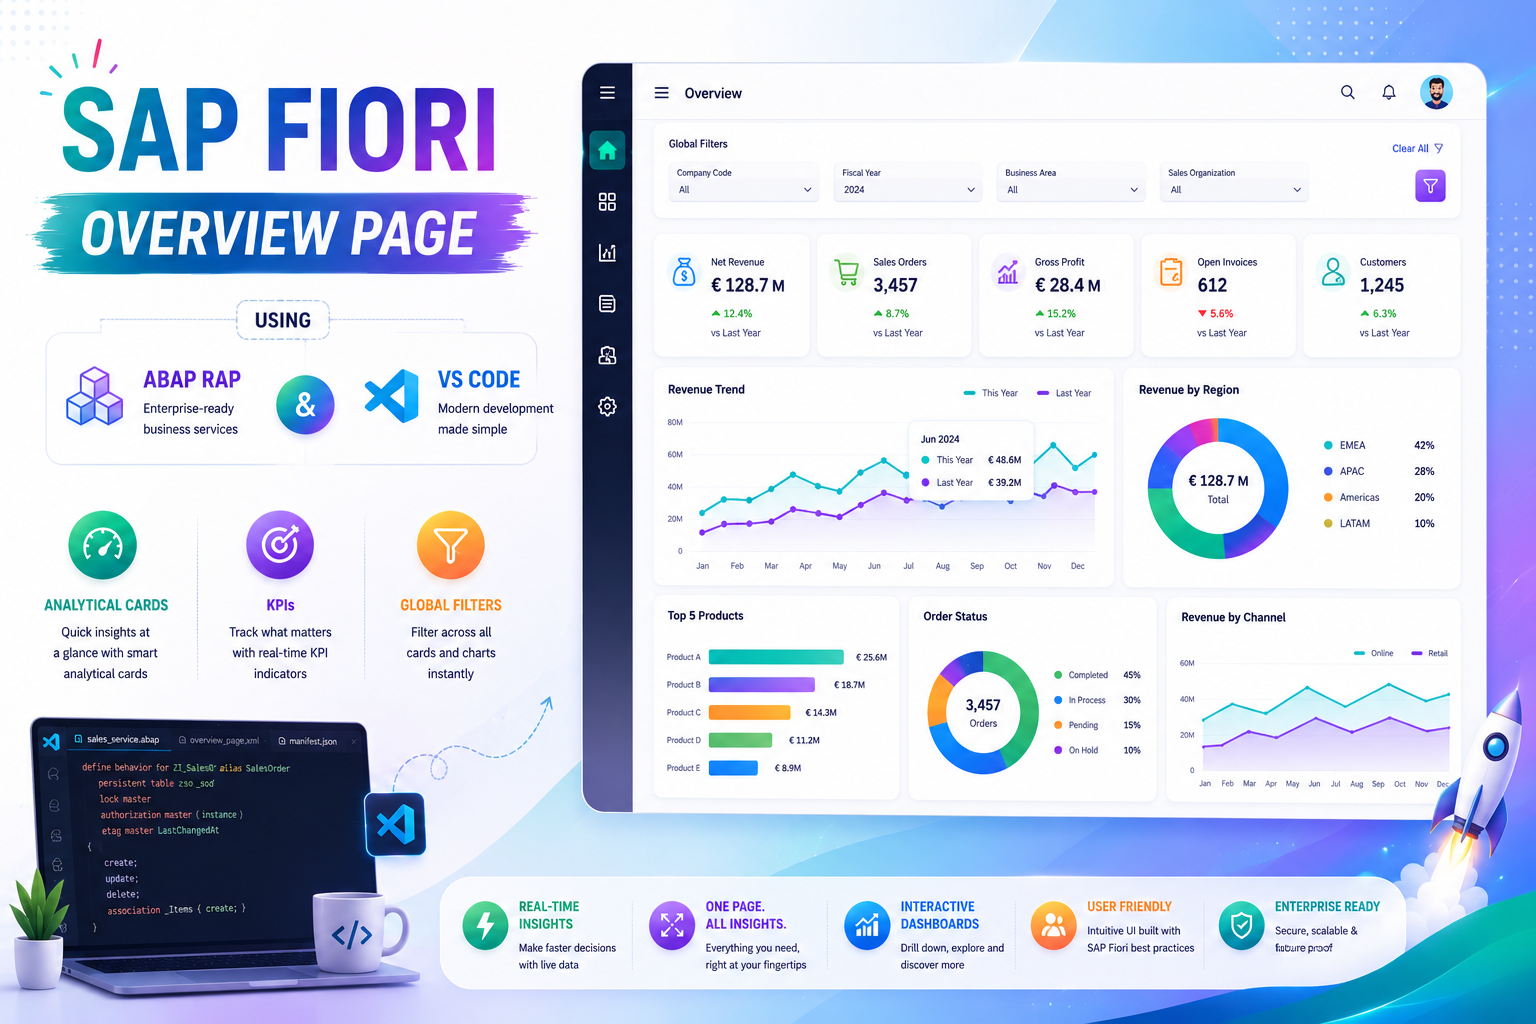
This comprehensive tutorial demonstrates how to build a complete SAP Fiori Overview Page from scratch using SAP ABAP RAP, CDS Views, OData V4 Services, and Visual Studio Code.
The journey begins in Eclipse ADT, where we create the foundational RAP artifacts including database tables, ABAP classes for test data generation, and multiple CDS Views that form the analytical backbone of the application. By carefully modeling employee, department, and managerial datasets, we create a scalable architecture capable of supporting enterprise-level reporting requirements.
A key focus of this implementation is the creation of analytical CDS Views that aggregate business data and expose meaningful metrics for visualization. These views leverage CDS annotations and semantic modeling techniques to prepare data for SAP Fiori analytical cards.
After exposing the data through Service Definitions and Service Bindings, we move to Visual Studio Code where the SAP Fiori Overview Page is configured using SAP Fiori Tools. The tutorial provides detailed guidance on configuring analytical cards, global filters, chart visualizations, KPIs, and navigation behavior.
Special attention is given to the implementation of Department Overview Cards and Monthly Manager Overview Cards. Through UI.Chart, UI.PresentationVariant, UI.DataPoint, and UI.Identification annotations, we transform raw business data into visually compelling dashboards that enable users to quickly identify trends, monitor performance, and make informed decisions.
The guide also explores advanced SAP Fiori capabilities such as global filtering, chart data labels, analytical navigation, and multi-card dashboard design, creating a modern analytical experience that combines usability with enterprise-grade functionality.
By the end of this tutorial, readers will have developed a complete SAP Fiori Overview Page application capable of delivering actionable business intelligence through interactive dashboards powered by SAP RAP.
Topics Covered
1. Introduction to SAP Fiori Overview Pages
- What is SAP OVP?
- Business Dashboard Concepts
- Role-Based User Experiences
- Analytical Application Design
2. RAP Backend Development
- RAP Architecture Overview
- Data Modeling Strategy
- Analytical Application Architecture
- OData V4 Service Exposure
3. Database Table Creation
- Employee Master Data
- Department Data
- Manager Information
- Business Entity Design
4. Data Generation
- ABAP Data Load Classes
- Test Data Population
- Sample Analytics Data
- Validation Techniques
5. CDS View Development
- Base CDS View Creation
- Year-Based Calculations
- Analytical Data Preparation
- Performance Optimization
6. Department CDS View
- Aggregated Department Metrics
- Employee Distribution Analysis
- Department-Level Reporting
7. Employee Detail CDS View
- Detailed Employee Analytics
- Manager Relationships
- Business Reporting Structures
8. Service Definition and Binding
- OData V4 Exposure
- Service Publication
- Metadata Generation
- API Validation
9. SAP Fiori OVP Development Using VS Code
- SAP Fiori Tools
- OVP Application Generation
- Dashboard Configuration
- Card Integration
10. Department Analytical Card
- Card Configuration
- Analytical Data Binding
- Chart Visualization
- KPI Presentation
11. Manager Overview Analytical Card
- Monthly Employee Analysis
- Management Reporting
- Trend Visualization
- Business Insights
12. CDS Annotation Configuration
UI.Chart
- Chart Type Definition
- Dimensions and Measures
- Visualization Setup
UI.PresentationVariant
- Data Presentation Rules
- Sorting and Grouping
- Default Display Configuration
UI.DataPoint
- KPI Definition
- Criticality Indicators
- Business Metrics
UI.Identification
- Navigation Configuration
- Context Information
- User Interaction Setup
13. OVP Card Configuration
- Card IDs
- Data Sources
- Navigation Targets
- Application Parameters
14. Interactive Dashboard Features
- Global Filters
- Analytical Navigation
- Multi-Card Interactions
- Dynamic Data Refresh
15. Advanced Chart Features
- Data Labels
- Improved Visualization
- User-Friendly Analytics
- Enhanced Readability
16. Final Dashboard Experience
- Department Overview
- Monthly Employee Analytics
- Management Insights
- Enterprise Reporting
Key Benefits
✔ Build enterprise-grade analytical dashboards
✔ Combine RAP and Fiori Elements effectively
✔ Create reusable CDS-based analytics
✔ Implement interactive analytical cards
✔ Configure KPIs and chart visualizations
✔ Enable global filtering and navigation
✔ Deliver real-time business insights
✔ Develop modern SAP analytical applications
https://drive.google.com/file/d/1SZ5tTSmCvFjXZLSBWHRARdLnEPGFDQF1/view?usp=sharing


 Prev Post
What do you think?
Show comments / Leave a comment